
The CIM Editor allows the user to create and refine a semi-formal model of a business process, an organisational structure and a data structure based on the input coming from the Domain Analysis Tool. The editor is able to create, change and store these types of models. As storage format, XML files are generated. The target users of this component are the domain user and especially the business analysts. Furthermore a model can be exported to a workflow management system or used as input for the PIM Prototyping Tool.
From an architectural point of view the component has one interdependency with other components for its input and two other for its output. The information, which is required for the creation of a CIM model, will be derived from the Domain Analysis Tool.
The output of the CIM level editor can have two different forms depending on its purpose. On the one hand a model on CIM level can be used for the orchestration of different applications based on a WfMS system. Therefore the activities that are performed by different VIDE or legacy applications and the control flow between them, is exported into the standard XPDL 2.0. The XPDL 2.0 exported by CIM Editor will be consumed by a WfMS such as RODAN’s OOWF. Using the standard XPDL 2.0 allows a vendor-independent integration of different WfMSs.
On the other hand the output of the CIM level editor is the starting point for the CIM to PIM transition wizard (called PIM Prototyping Tool). In this case the editor doesn’t provide the models in XPDL 2.0, as this format does not support the entire Vide CIM level language VCLL. Hence, the models are delivered in a different XML format for the purpose of creating new Vide applications or services.
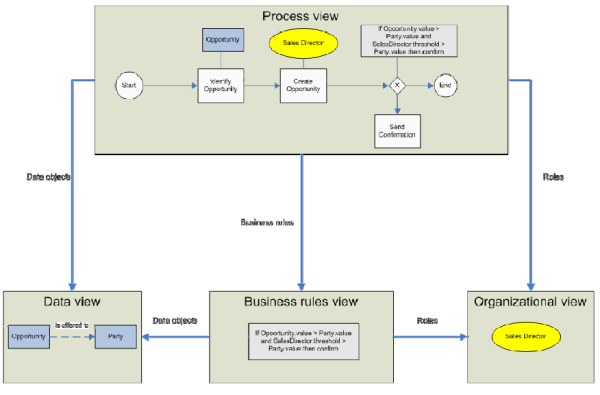
Figure 20: VIDE CIM modelling views
The data view is a common model element of both the data and the process view. The expressiveness of the Data view models is similar to ERM.
The organisational view describes the organisational structure that is related to an underlying activity. The core element of the organisational view is the role.
The business rules view introduces constraints for the process view that involve data and organizational view constructs modelled before.
The most extensively represented view is the process view, which integrates the other views and has additional functionalities as annotation of the process elements, import from Domain Analysis Tool and export to the workflow engine.
On the one hand the CIM level models can be used as a user’s description in order to create an application with the VIDE CIM level language. On the other hand the VIDE CIM level language provides the opportunity to orchestrate an application. For this second orchestration branch the Vide CIM level language describes the control flow between different applications. This description is exported in form of the vendor independent standard XPDL 2.0 and can be used in a workflow management system which implements the orchestration.
The CIM Editor supporting the VCLL has as requirements to offer possibilities to (see also Figure21):
Open model with basic elements from Domain Analysis Tool
Build and refine CIM models out of the Domain Analysis Tool using its input as necessary
Export the CIM model for the PIM Prototyping Tool
Export the CIM model to a workflow management system
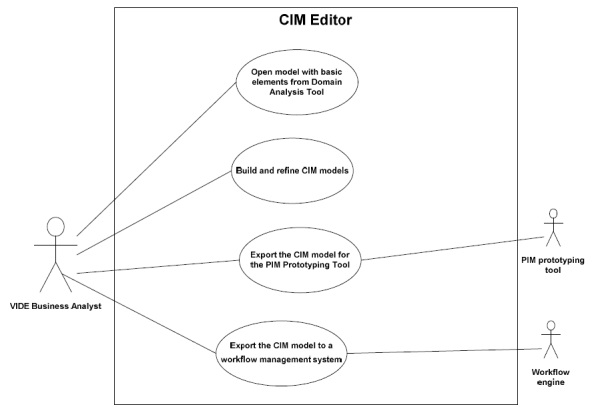
Figure 21: Use case diagram for the CIM Editor component
In this section a kind of walkthrough is offered with respect to the use case stated before. Basically the four steps from creating a process diagram from Domain Analysis Tool over modelling and exporting the models to the workflow engine and PIM Prototyping tool are covered.
Firstly, a project must be created to contain the process and other kinds of diagrams. To do this, right-click inside a package explorer of Eclipse and choose New Project… In this guide the project name is Process.
There are two ways of creating the process editor diagram. The first one is to create a Vide CIM level language diagram directly from scratch, the second one is to use the input from the Domain Analysis Tool. To use the CIM editor create a new model inside the package explorer with right click New Other VCLL Editor Views or open an existing model by a double-click (see Figure 22).
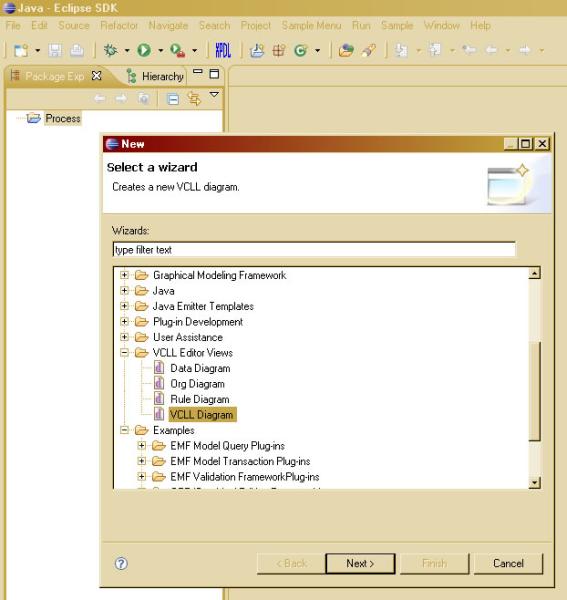
Figure 22: Create new VCLL editor
A new VCLL diagram will be created with an initial pool and a task in it offering to extend already existing constructs rather than to make the two first simplest steps oneself (see Figure23).
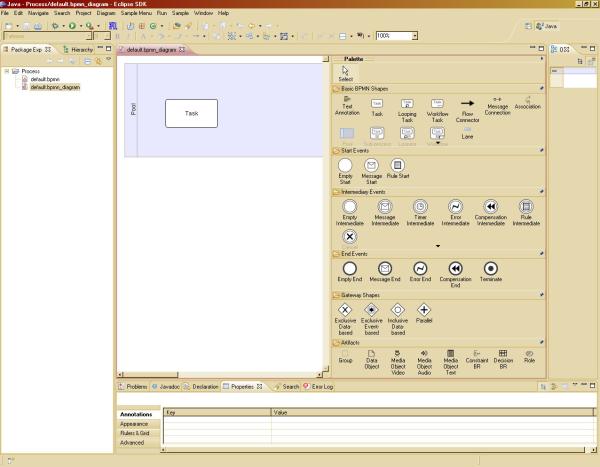
Figure 23: Newly initialized VCLL diagram with one pool and a task
If the Domain Analysis Tool input is used, the business analyst has to import the *.shapesrc file into dedicated project folder and choose an option for initializing the VCLL diagram from the context menu (see Figure24).
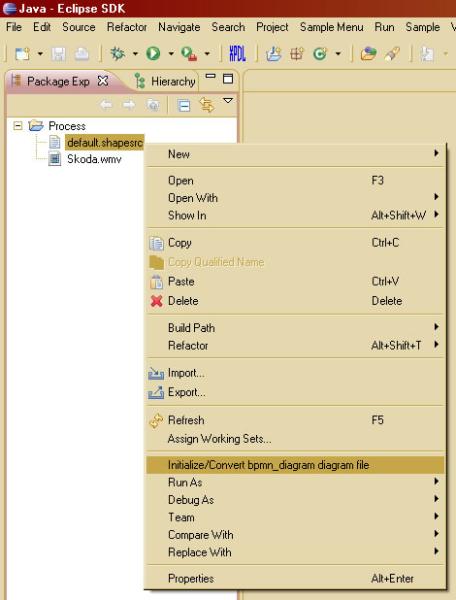
Figure 24: Initialize VCLL editor from the Domain Analysis Tool
In this way, basic model elements are already created and can now be further enhanced (see Figure 25).

Figure 25: VCLL editor initialized from the Domain Analysis Tool input
As soon as a model has been created by means of importing it from the Domain Analysis Tool or creating it from scratch it is time to add the necessary refinement constructs to the model. It can be done in four different views:
Data view – is responsible for the data side modeling of the process,
Organizational view – here is the place where the organization hierarchy is modeled,
Business rule view – constraints imposed on organization and data objects can be modeled in this view,
Process view – this view can be initialized through import from the Domain Analysis Tool. It is the view where the control over the sequence of actions happens. It can include or in other words reference any object from data, organization or business rule views.
In this step a data model diagram is being created.
First, create a data diagram as follows: in the newly created project right-click on the folder and choose New VCLL Editor Views Data Diagram and set a name. If a project already exists, you can create the model inside the existing folder, too.
In the data diagram editor, add the following data objects: Opportunity, Item and Party. This is done by clicking on the data object symbol in the palette and then clicking on the editor pane for each object (see Figure 26).
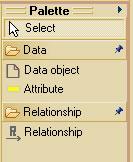
You can add easy attributes to each of the objects by clicking on the attribute object symbol in the palette and then clicking on the according data object in the data diagram editor. If you add attributes, you should see an input mask consisting of two fields separated by a colon. The first field is the attribute’s name and the second – its type (see Figure 27).
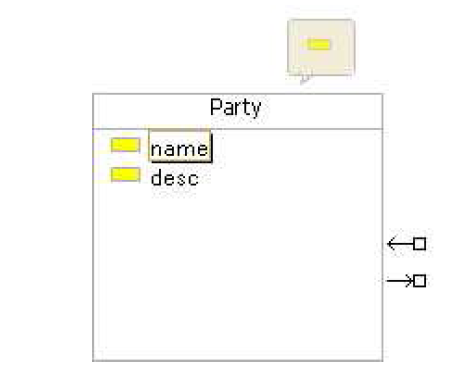
Figure 27: Data view object with attributes
The objects can be connected through relationships. This is done by clicking on the relationship symbol in the palette and then clicking on the source object and dragging the connection to the target object. Let’s connect Opportunity to Party and name this relationship ‘is offered to’. Analogously the connections Opportunity to Item and Item to Party are created.
Click on Save button in the toolbar. With this step the simple data model is complete. At the end it may look like in Figure 28.
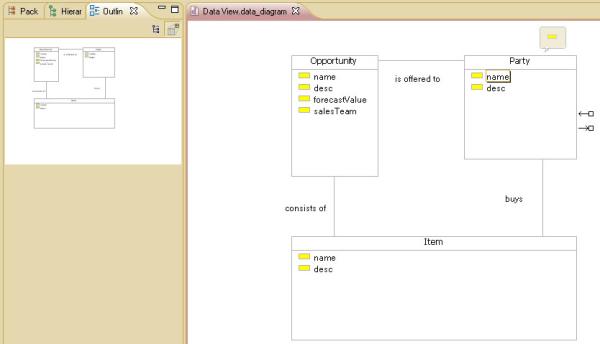
Figure 28: Data view simple model
In this step an organizational model diagram is being created.
First, create an organizational diagram like follows: inside the created project do a right-click on the project an choose New VCLL Editor Views Org Diagram. Let’s name it Org View.
In the organizational diagram editor, add the following objects: a role Sales Director and a person Mr. Taylor. This is done by clicking on the role and person symbols in the palette accordingly and then clicking on the editor pane (see Figure 29).

Figure 29: Role view palette
The next step is the connection of a person Mr. Taylor to a certain role, in this case Sales Director. This is done through an assignment connection. Click on assignment symbol in the palette, then on the Mr. Taylor and drag it on Sales Director.
Other roles, people and organizational units can be added through palette as well as through editor pane pop-up menu (see Figure 30).
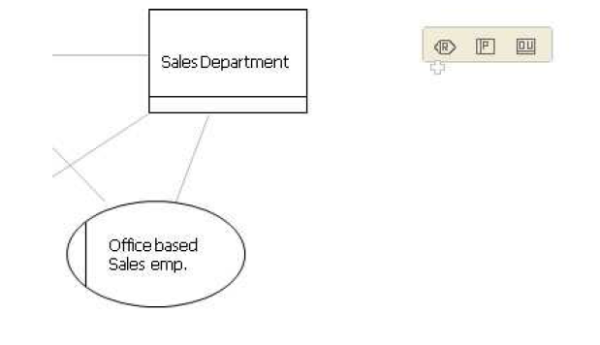
Figure 30: Role editor pane pop-up menu
Click on Save button in the toolbar. The Organization model may look like in Figure 31. Now there are two simple models complete and you can proceed with business rules and process modeling.
Figure 31: Role view simple model
In this step a business rule model diagram is being created.
First, create a business rule diagram like follows: in the project do a right-click on the project an choose New VCLL Editor Views Rule Diagram. Let’s name it Rule View.
In the business rule diagram editor, add the following objects from the business rule palette (see Figure 32): a business rule container Opportunity Rule, two terms ‘Opportunity.forecastValue > Threshold’ and ‘Opportunity.salesTeam != Null’ as well as two keywords IF and THEN inside it.
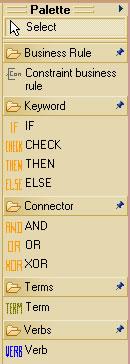
Figure 32: Business rule view palette
The components of a business rule can be added in arbitrary sequence, as it is always possible to rearrange the object by dragging them (see the following sequence).
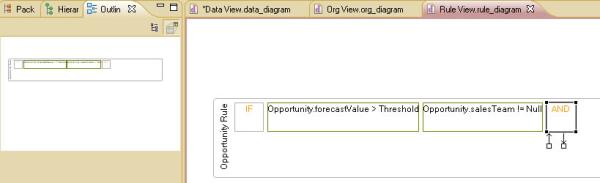

You can also insert the elements at the arbitrary positions like it is shown in Figure 33. The vertical black line between the two last shapes indicates the point of insertion.

Figure 33: Business rule view arbitrary insertion
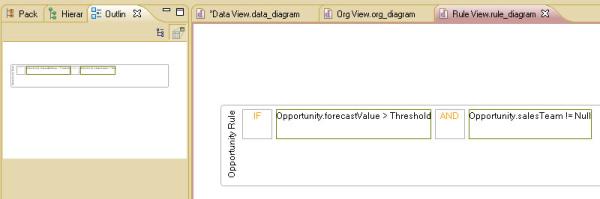
After modeling is finished the rule model may look like in Figure 34. Three views are now complete – data, organizational and business rule. The process model itself is the next step.

Figure 34: Business rule view simple rule model
In this step a process model diagram is being created. We assume the first way of creating a diagram, namely from scratch through New menu in project tree has been used. First, four objects are created in order to represent a process flow and then two objects from the previous models are added to the process view.
First, create a VCLL Diagram in the following way: in the newly created project do a right-click on the project and choose New VCLL Editor Views VCLL Diagram. Let’s name it Process View.
Inside the VCLL diagram a pool and a task are automatically created. You can change the pool’s name by double-clicking on its label and entering a new name, for example Opportunity Process. You can rename the automatically created task into Identify Opportunity by double-clicking on its label and entering a new name (see Figure 35).

Figure 35: Process view change task name
In the Start Events section of the palette there is in the first place an Empty Start (see Figure 36), which you can set before Identify Opportunity and connect it through Flow Connector from the first section (see Figure 37).
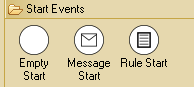
Figure 36: Start Events
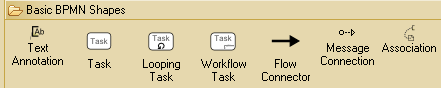
Figure 37: Basic process shapes
Please add a second task (the model element is contained in the first section), name it Create Opportunity and connect the first task through Flow Connector to it.
Please add an Empty End event from the End Events section (see Figure 38) to the right of the previously created task and connect this task to it though Flow Connector.

Figure 38: End Events
This step represents the connection of elements from other views to the process view. Right-click on the editor pane and choose Create shortcut… from the context menu (see Figure 39). Expand the Data View file and click on the Opportunity object in it (see Figure 40). Click on Ok. Object Opportunity is inserted from another diagram. Connect it to ‘Create Opportunity’ through Association connector in the first palette section.
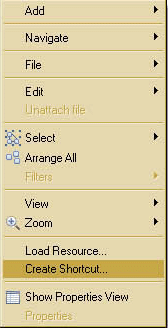
Figure 39: Create shortcut context menu
Figure 40: Data object shortcut
In addition to shortcuts to data elements you can also create links to other views. Do a right-click on the editor pane and choose Create shortcut… from the context menu. Expand the Org View file and click on the Sales Director object in it. Click on OK. Object Sales Director is inserted from another diagram. Connect it to Identify Opportunity through Association connector in the first palette section.
The same way you created a shortcut to role and data object, you can create a connection to a business rule through the same function. Right-click and create a shortcut to Opportunity Rule created before and connect it to Create Opportunity through an association from the palette.
There are also Shapes that are not concerned in BPMN standard. At the artifacts section there are media objects and business rules with roles. Please add a Media Object Video to the diagram and connect it with an association to Identify Opportunity.
Click Save button. Process model may look like in Figure 41.

Figure 41: VIDE CIM process model example
Although the modeling is almost complete, there is a couple of further useful functionalities for the business analyst:
The first one are the ‘instant’ data or business rule mini-views, without the need to change into appropriate model view. From the process view, right-click the data object (see Figure 42) and the business rule object (see Figure 43) – the new views usually appear at the bottom of the perspective dependent on the screen configuration (see Figure 44 and Figure 45 respectively).

Figure 42: Process view data object context menu
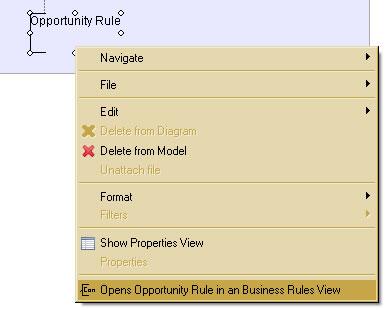
Figure 43: Process view business rule context menu
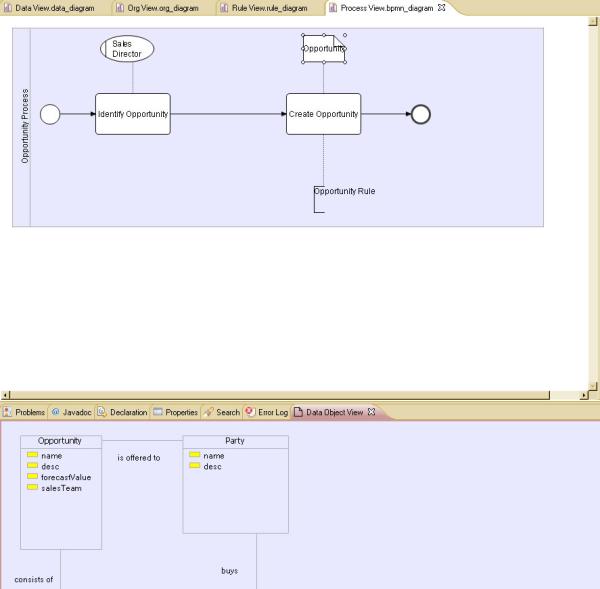
Figure 44: Process view data mini-view
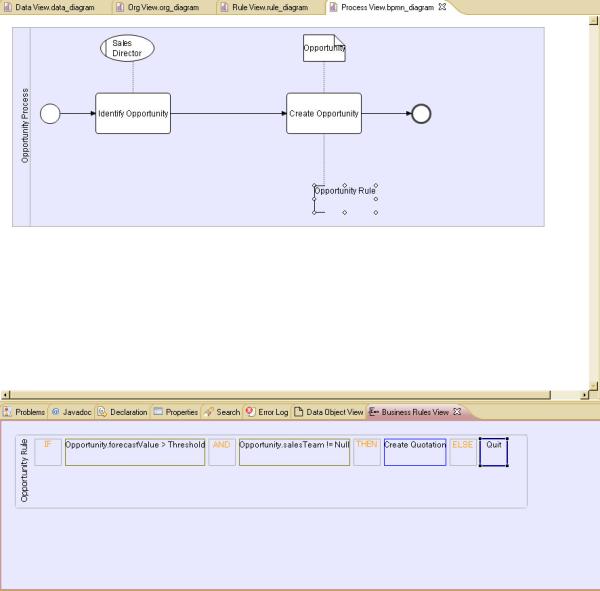
Figure 45: Process view business rule mini-view
The next useful functionality is the drag-and-drop annotation for process model objects. You already noticed the media file in the project – Skoda.wmv. To annotate one of the objects in the process view with this file simply drag it from the project tree onto the diagram pane. After annotating an object with a file you can open it with system default editor and watch video, hear speech or read text (see Figure 46)
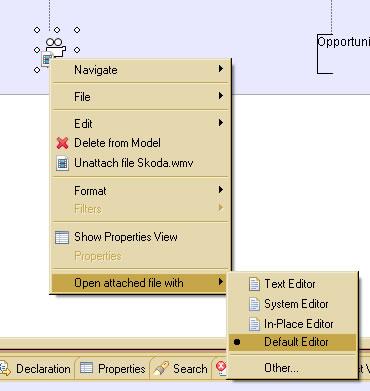
Figure 46: Process view open media
Now the example process and the other views are complete. The information can now be further used to export files for the workflow engine and for the PIM prototyping tool which can be started with the according button in the toolbar.
The next steps concerning the further process is described in section 2.3.2.
If your model represents a high level process showing which services will be called by a workflow management system, then you will use the XPDL export from the toolbar – a file will be created in the same project with the same file name and extension *.xpdl ready to be consumed by Rodan’s workflow engine.
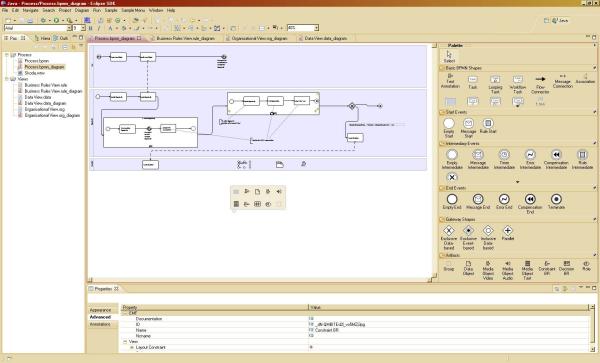
Figure 47: XPDL transformation toolbar icon
In order to do the XPDL export into the workflow tool, there is an extension button in the toolbar (see Figure 47). Once you have opened a VCLL editor and wish to export this specific data format for the currently opened file, you can click the XPDL button. By this way you can create the requested file in the same project folder as the source file. As soon as the file is created the correct transformation should be confirmed by a dialog window shown in Figure 48. The written file with the *.xpdl extension is first seen after a manual refresh and contains the standard constructs that could be extracted from the underlying VCLL diagram and transformed according to XPDL specification.
Figure 48: XPDL transformation confirmation
These exercises aim to cover features not mentioned in the “Step by step guide” section
Do a right-click over the rule diagram editor to add an object from either data or role editor diagrams
Do a right-click over the rule diagram editor to add an object from either data or role editor diagrams
Drag and drop a file object from the project tree of the open process diagram to an object inside the diagram to annotate it.